


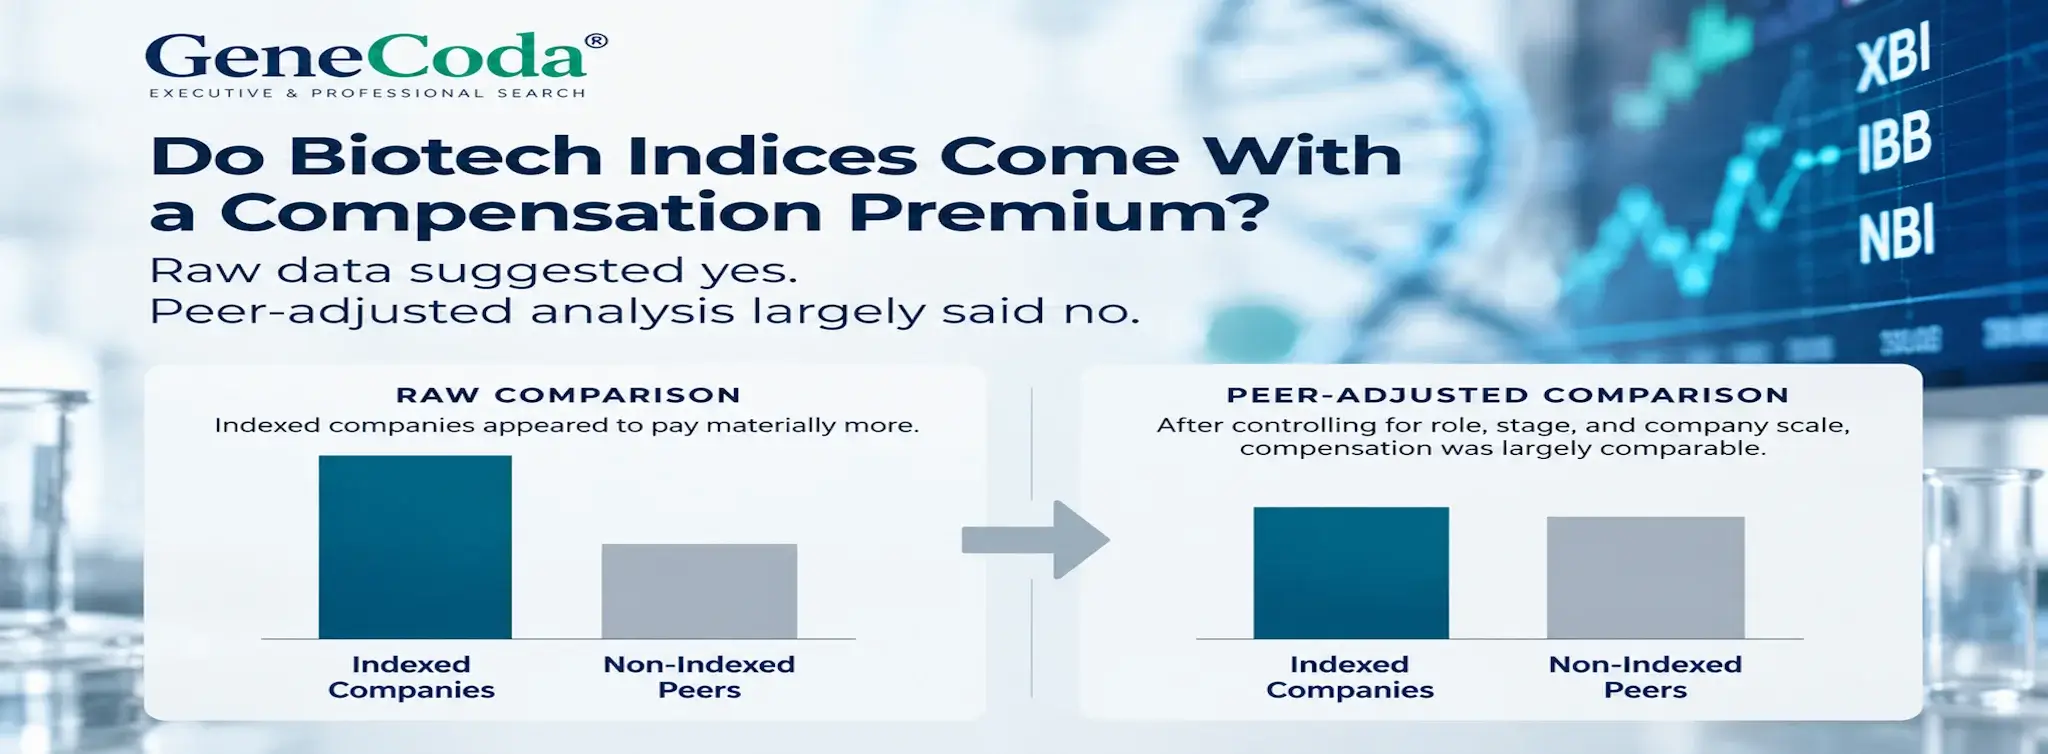
Do Public Biotech Companies in Major Indices Pay Executives More? We expected the answer to be yes.
Public biotech companies included in major indices such as XBI, IBB, and NBI tend to be larger, more visible, and more heavily institutionally owned than many public biotech companies outside those indices. It seemed reasonable to expect those differences to show up in executive compensation.
At first glance, they did.
Using GeneCoda’s governed FY2025 public biotech executive compensation database, indexed companies showed materially higher unadjusted compensation across several senior roles. The gap was especially noticeable in equity and total compensation.
For example, median total compensation was substantially higher among indexed companies for CEOs, CFOs, CMOs, COOs, CSOs, and General Counsel / Legal executives.
That appeared to support the original hypothesis. But the comparison was not yet a fair one.
The problem with the raw comparison
Indexed and non-indexed biotech companies are not distributed evenly across company size and maturity.
In our dataset, indexed companies were much larger on a historical scale basis. Among active companies with usable scale data, the median scale proxy for indexed companies was approximately $480 million, compared with approximately $52 million for non-index companies.
That difference alone creates a major comparability problem.
If larger and more mature companies tend to pay executives more, then a raw indexed-versus-non-indexed comparison can easily make index membership look more important than it actually is.
So we tightened the analysis.
What happened after peer normalization
We compared executives by:
- Normalized executive role;
- Controlled company development stage; and
- Company scale.
As the scale controls became more precise, the apparent index premium steadily weakened.
- Using relatively broad scale quartiles, indexed companies still showed an adjusted total-compensation difference of roughly 14%.
- Using scale quintiles, that fell to roughly 4%.
- Using scale deciles, the difference fell to approximately 1%.
A separate continuous-scale adjustment produced a total-compensation difference of approximately 3%.
We then ran an even stricter peer-equivalence test using closely matched indexed and non-indexed executives in the same role, at the same development stage, and at companies of similar scale.
Across 78 closely matched pairs, the differences were:
- Salary: approximately -0.2%
- Cash compensation: approximately +0.4%
- Total compensation: approximately +3.7%
In practical terms, those results were close to parity.
Equity was different, but not stable enough to carry the conclusion
Equity compensation remained the one area where indexed companies sometimes appeared to pay more.
In the close-peer comparison, equity compensation was approximately 27% higher among indexed companies.
However, that result was not stable across analytical specifications or roles.
Depending on how scale was controlled, the estimated equity difference ranged from slightly negative to materially positive. Role-level results were also inconsistent, and several roles did not have sufficiently large matched samples to support a strong conclusion.
For that reason, we do not believe the current data support a broad claim that index membership independently produces an equity compensation premium.
What surprised us
The original hypothesis was plausible.
Major biotech indices contain companies with greater market visibility, deeper institutional ownership, and often more mature corporate structures. Those characteristics could reasonably be expected to correspond with higher executive pay. The raw numbers appeared to confirm that expectation.
But after controlling for the characteristics that actually make the companies more comparable, most of the apparent compensation premium disappeared.
Our FY2025 data therefore provide little evidence of a robust independent index-membership premium in salary, cash compensation, or total compensation.
That does not mean index membership has no effect on executive compensation. This is observational data, and the analysis does not establish causation.
It does mean that index membership itself appears to explain much less than the raw comparison initially suggests.
The larger lesson
This analysis reinforces a broader issue in executive compensation benchmarking.
The peer set matters.
A compensation comparison can look compelling while still being driven primarily by differences in company scale, development stage, commercialization status, or executive role.
In this case, the indexed companies really did pay more on a raw basis.
The more useful question was why.
Once we compared more equivalent companies, much of the difference turned out to be associated with the kinds of companies represented in the indices rather than index membership alone.
That was not the result we expected when we started the analysis. It was also the more useful one.
Methodology note: Analysis based on GeneCoda’s governed FY2025 public biotech executive compensation database. Comparisons use Include observations and evaluate index membership alongside executive role, controlled company stage, and company scale. Results are directional and do not establish causation.




 When Facebook announced its name change to Meta in October 2021, the idea of a metaverse became a reality for millions of people who had never heard of the term before. Tech experts on the other hand were revelling in the growing interest in the virtual world. While Meta is just one way that a company is harnessing the metaverse for a social media reason there are many others that can see a future for life sciences online, utilizing this new power to improve outcomes. We took a look at how the metaverse could work to improve access to clinical trials and ensure a more diverse population takes part.


